
The Gift That Keeps Us Driving
Urban Design and Urban Sprawl | Timothy Na
Whenever I look outside my window down onto Grafton Gully, I see a long parade of cars stretching the entirety of Highway 16, accompanied by the idle drone of six lanes’ worth of traffic keeping me awake. That lazy flow of cars is a symptom of a larger problem in the complex system powering Auckland: urban sprawl.
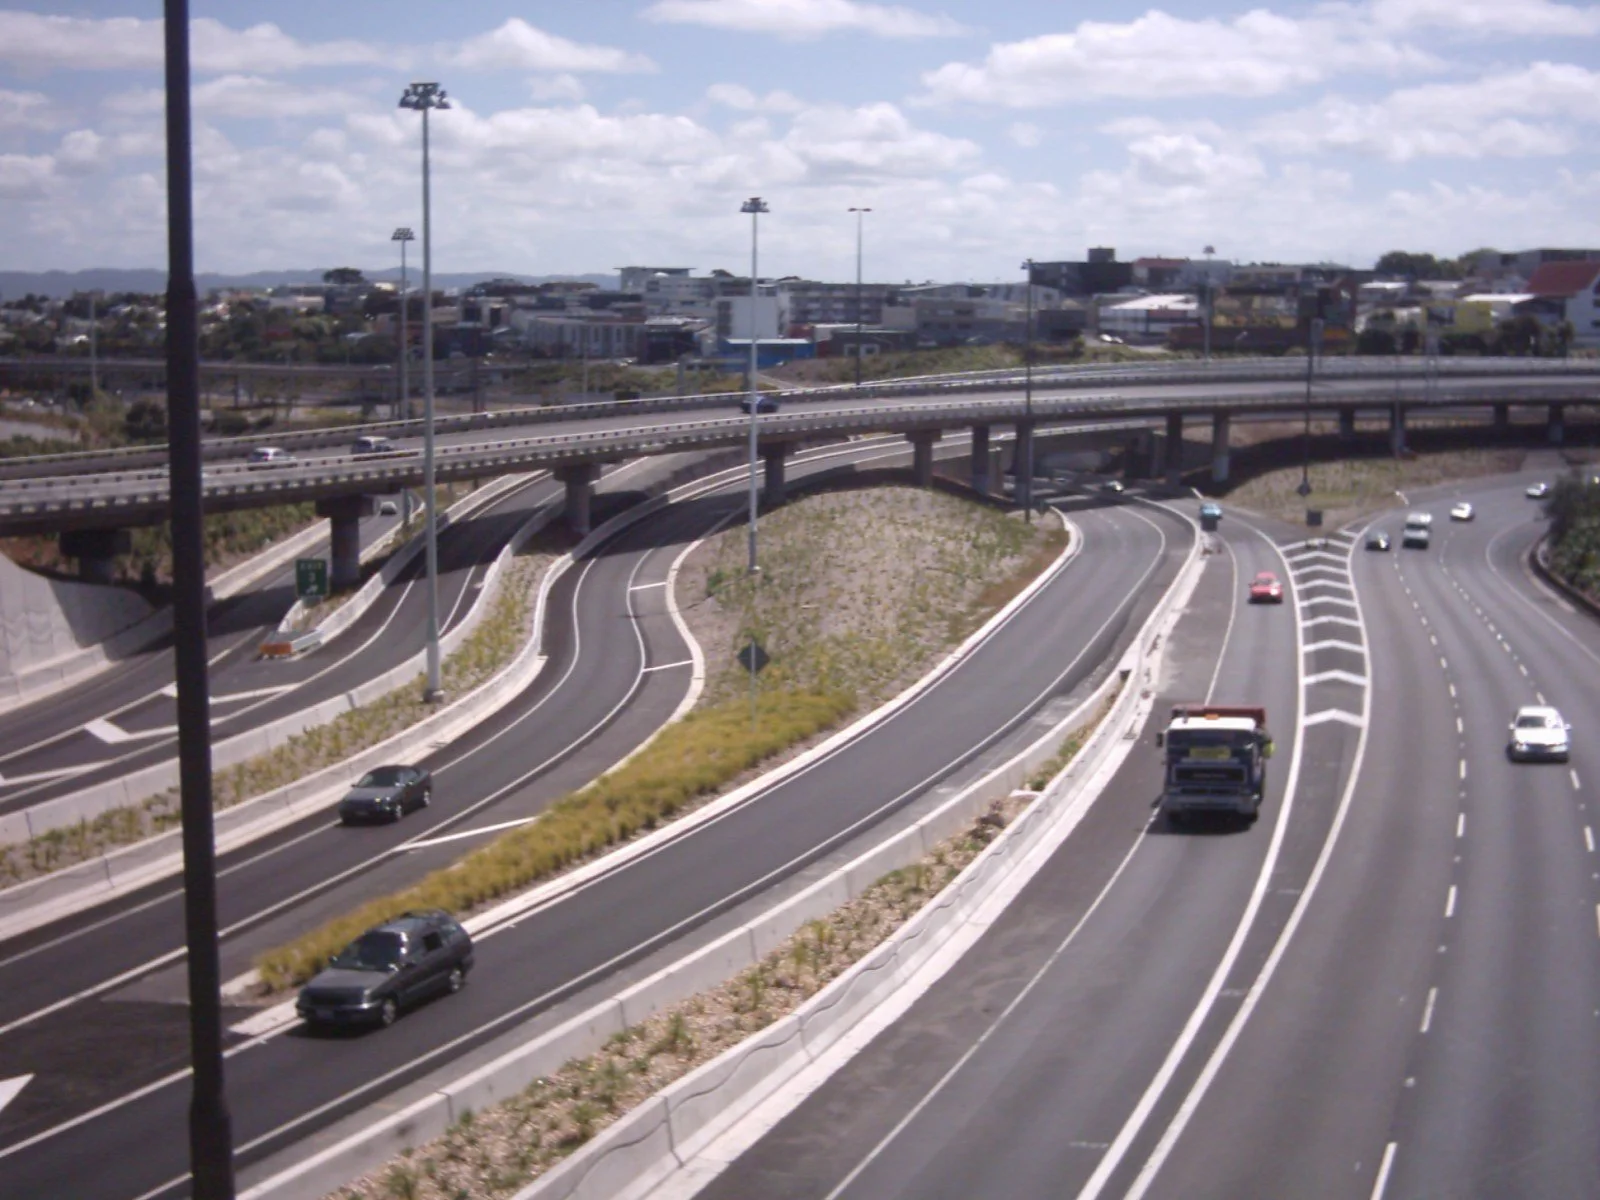
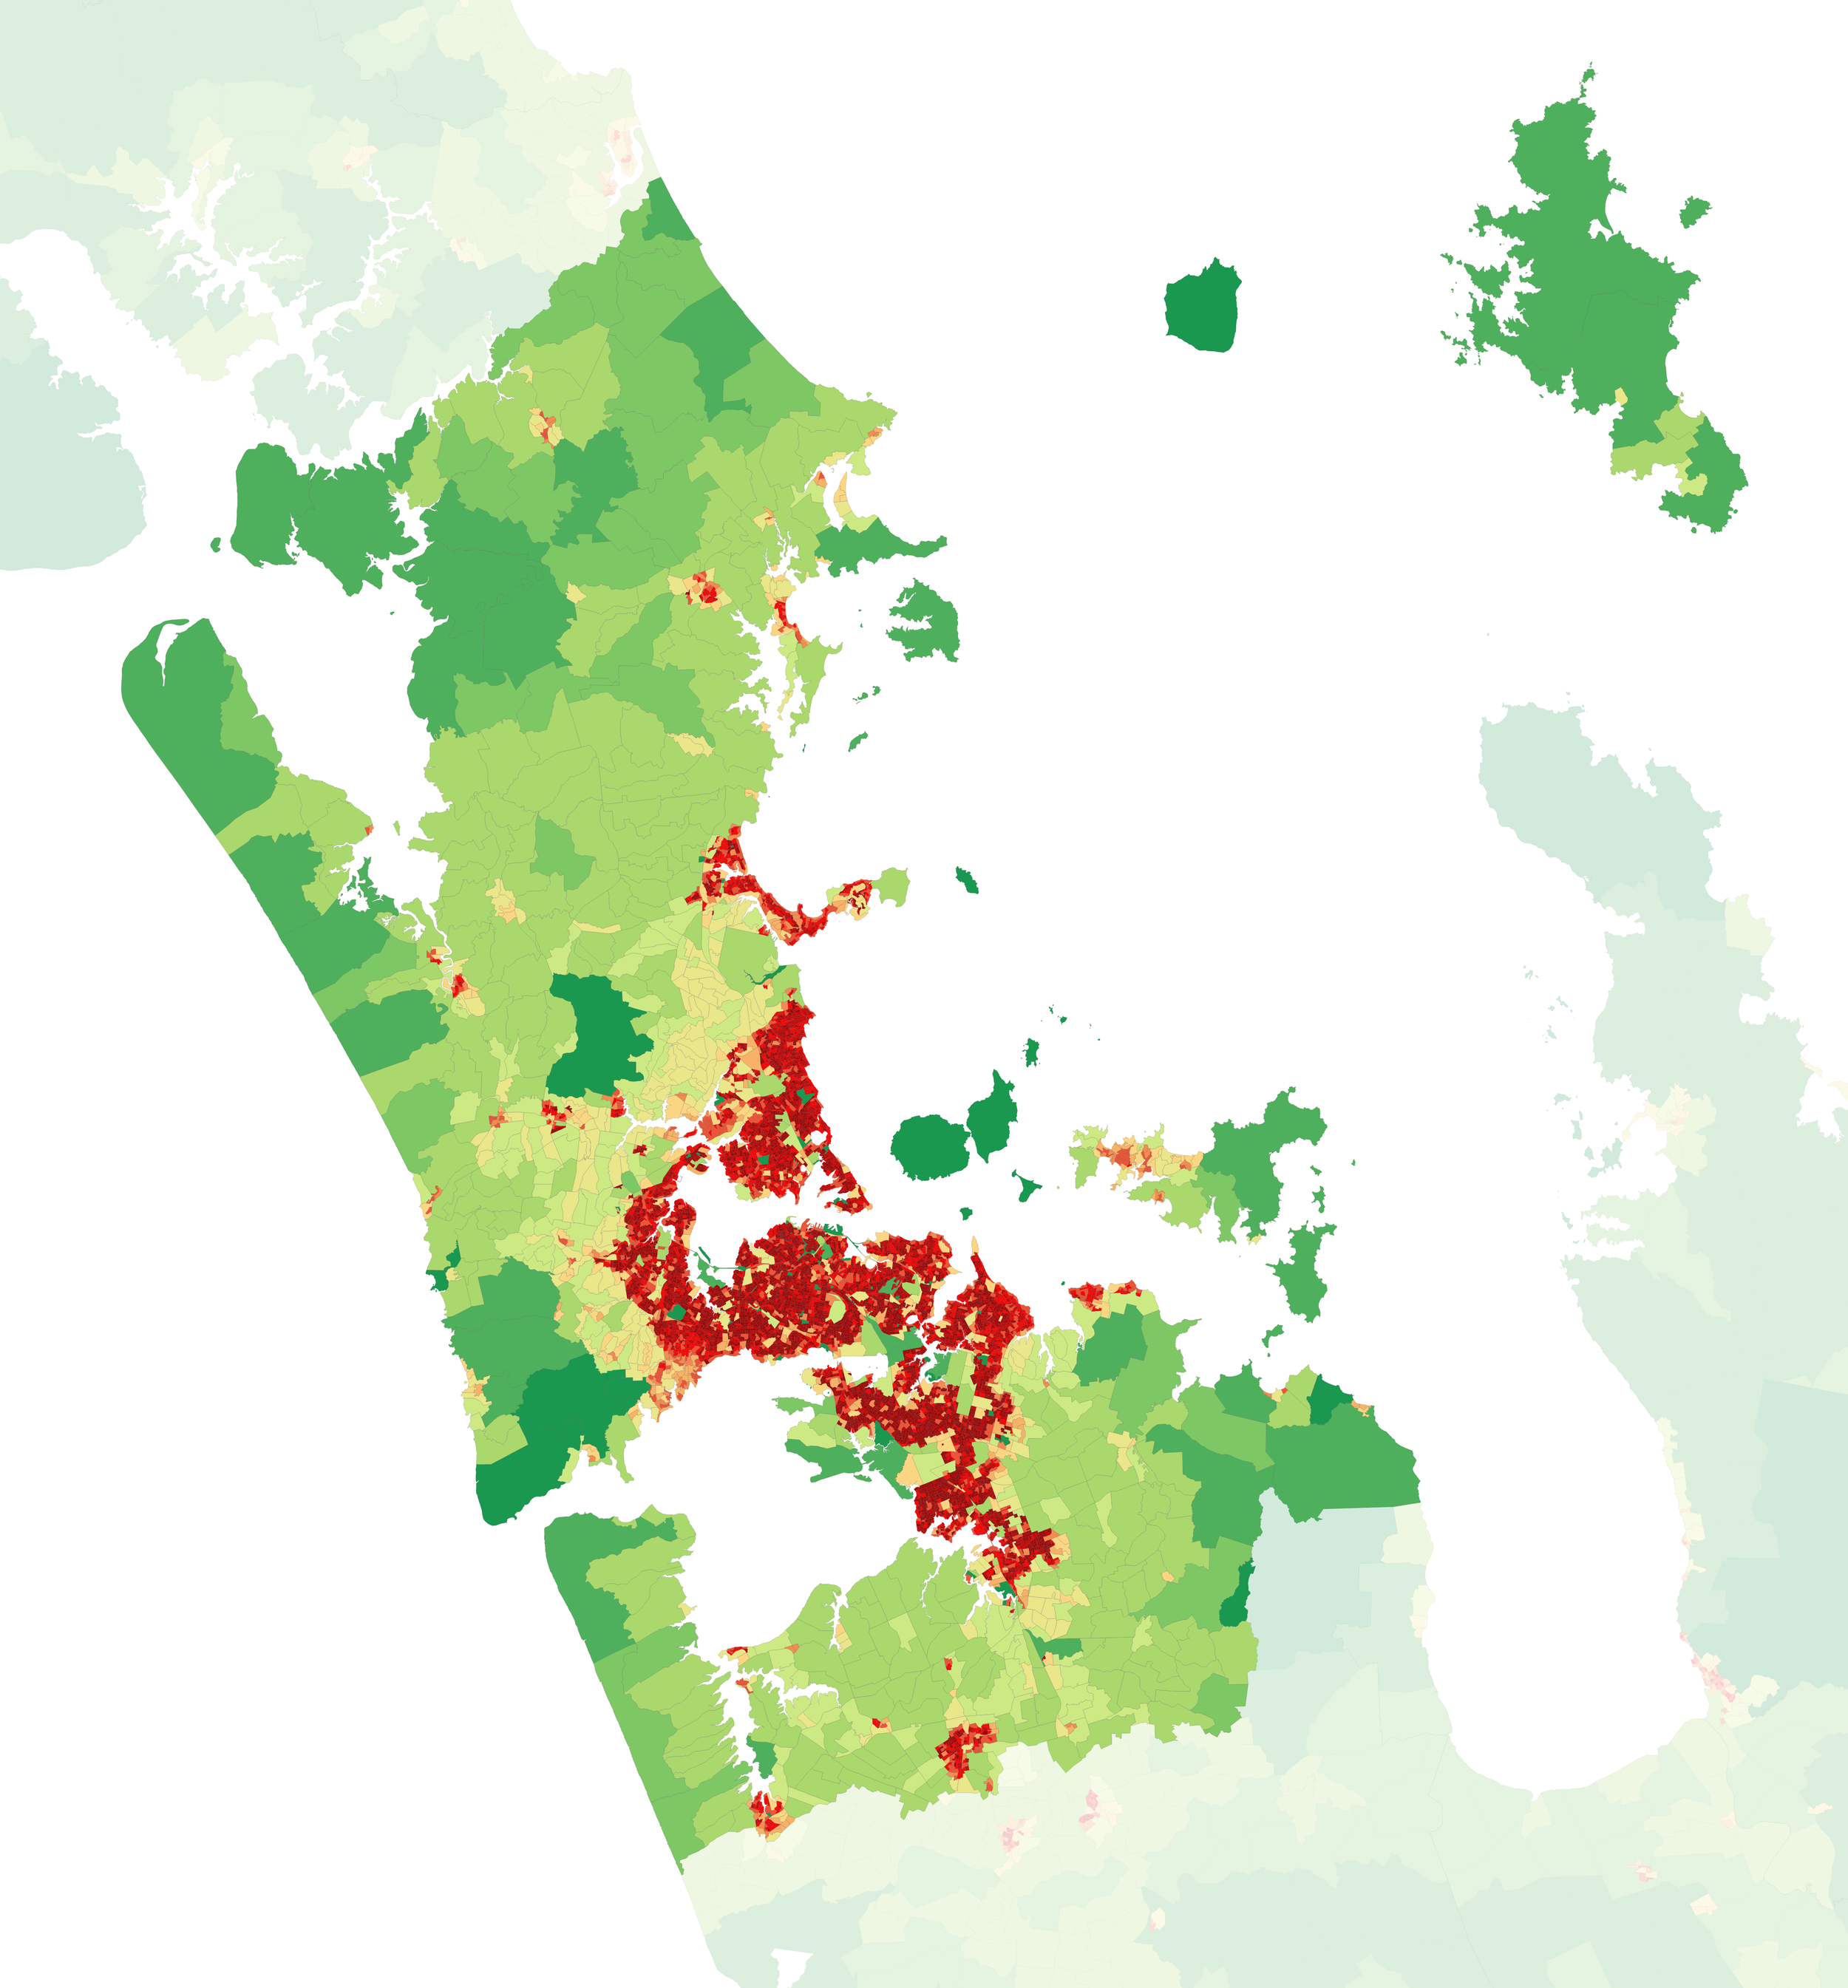
Figure 2: Auckland Population Density in 2023, showing where urban areas are located. [6]
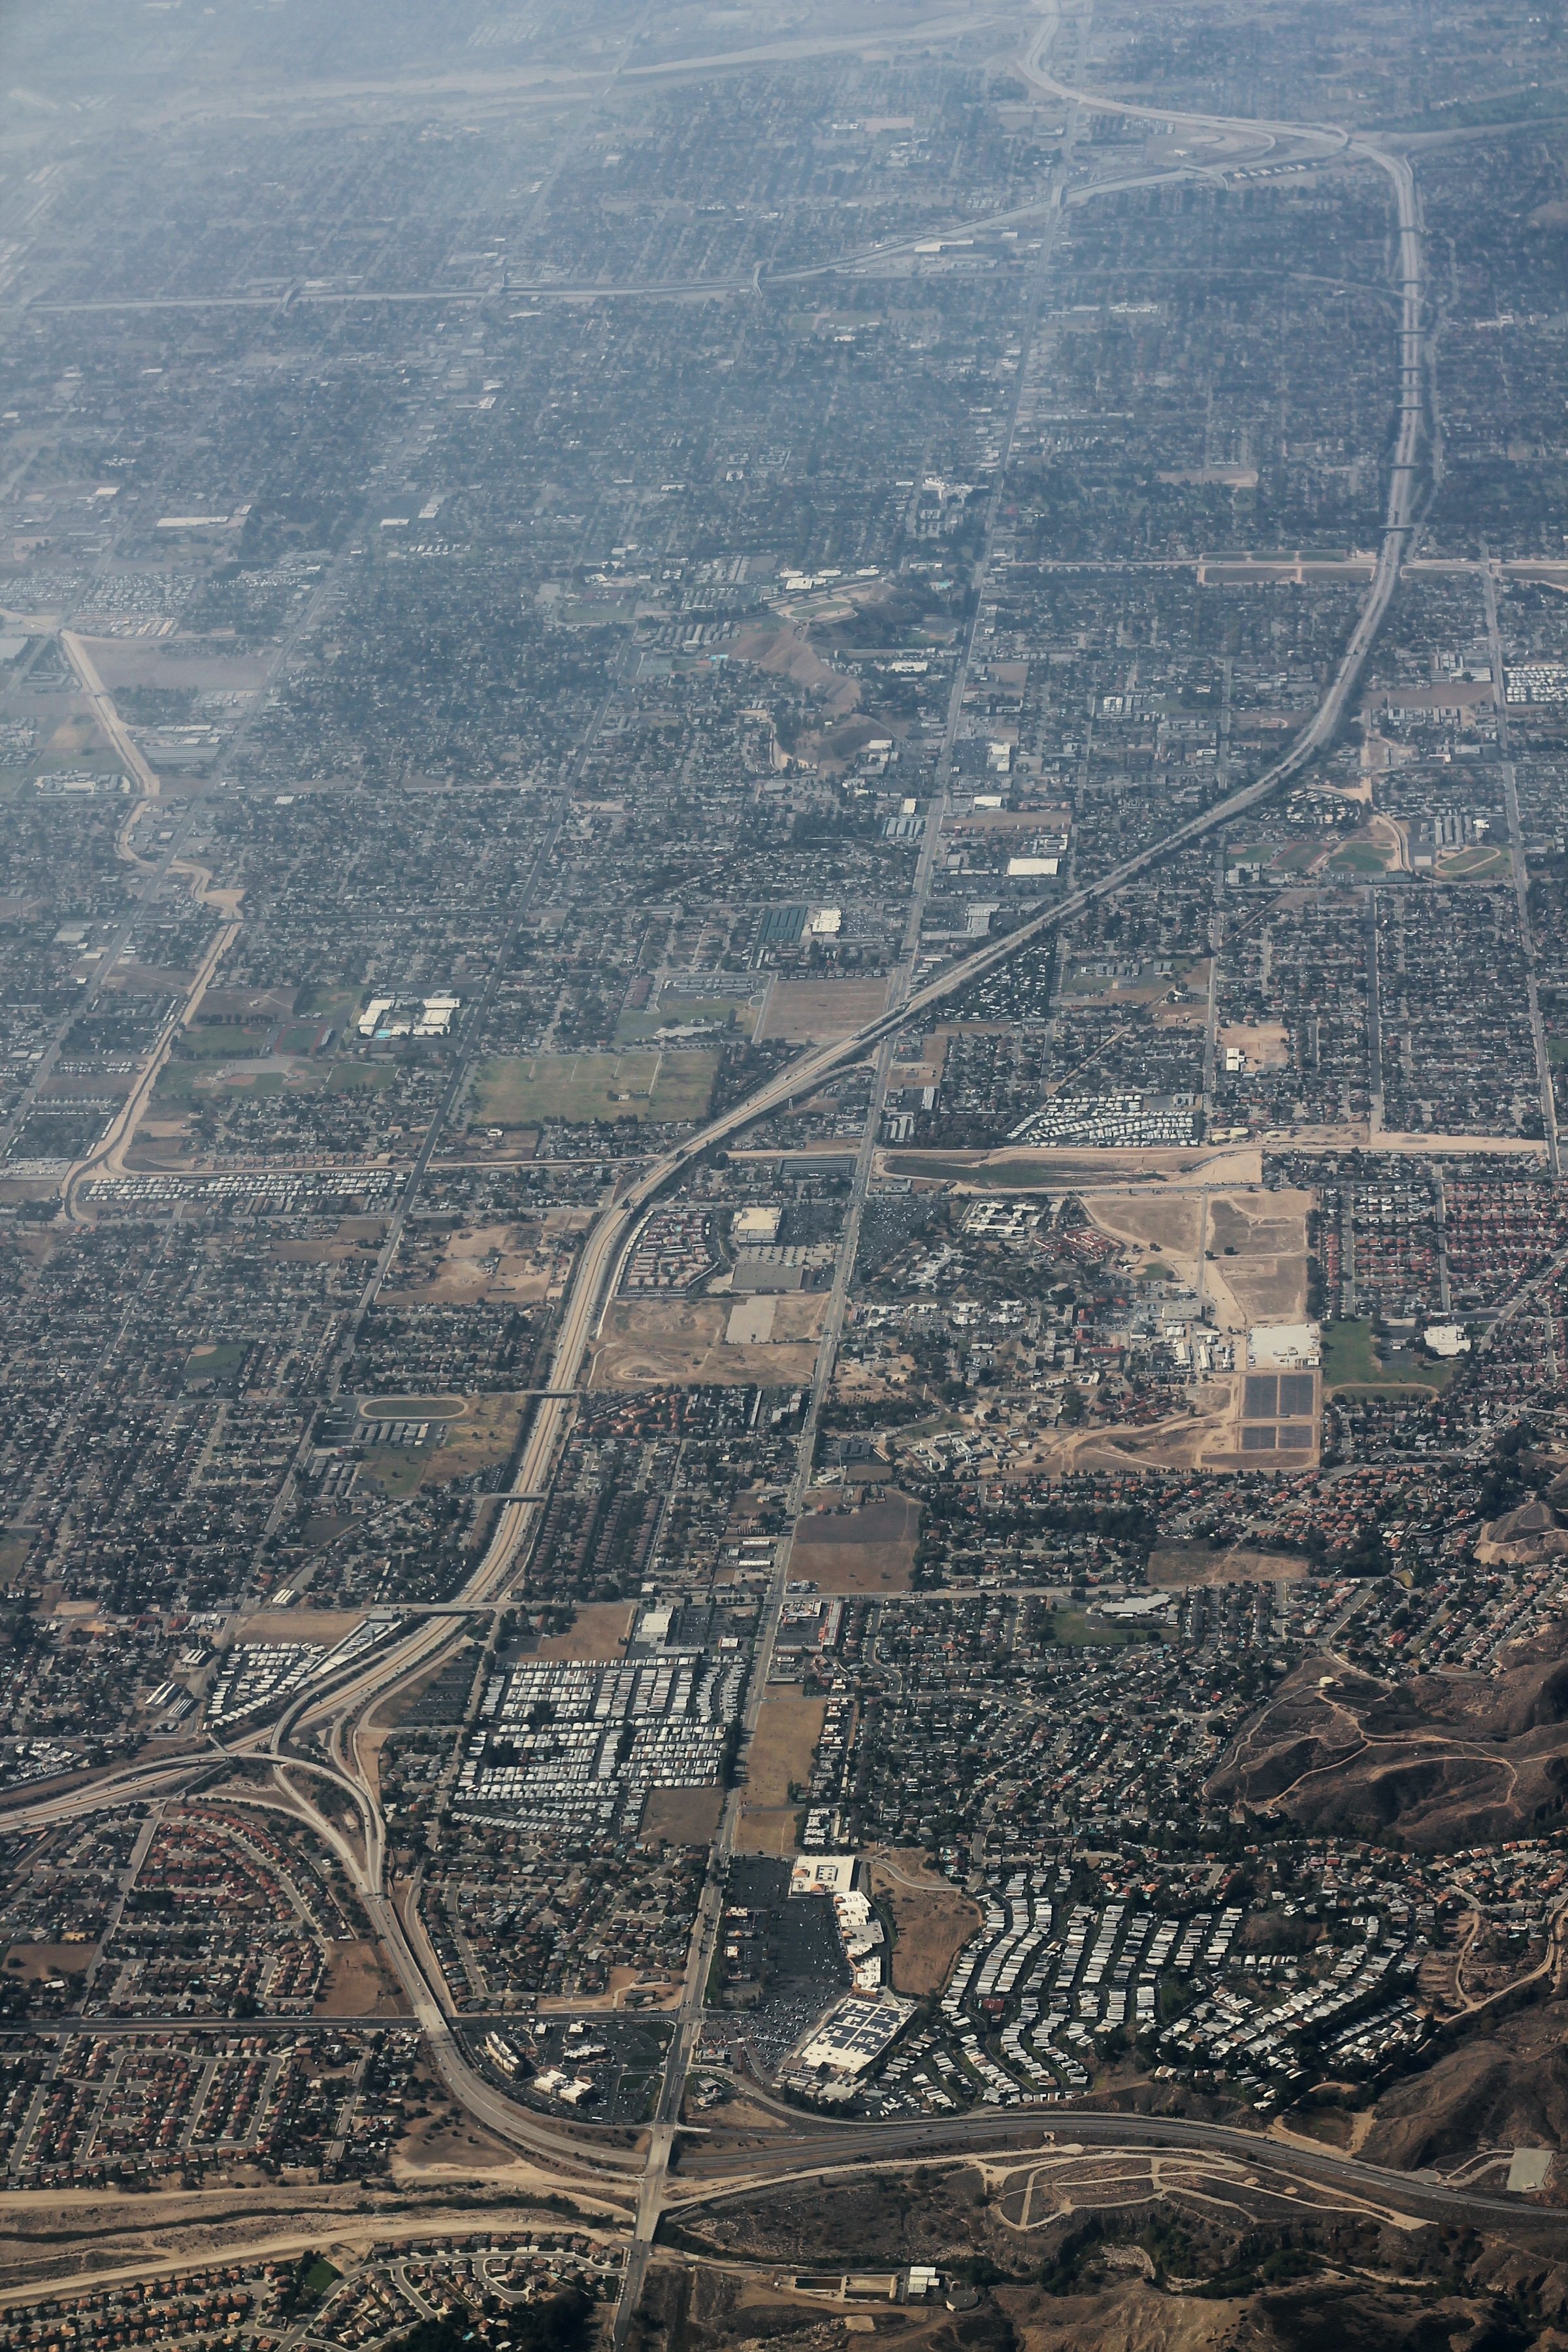
Figure 3: Aerial view of San Bernardino, California, USA. [16]
Figure 1: Auckland Central Motorway Junction, also known as ‘Spaghetti Junction’. [1]
For some historical context, Auckland was not a planned city. It grew out of the massive Waitematā Harbour and expanded rapidly at the turn of the 20th century [2]. This set the stage for a suburban boom fifty years later as cars and post-WWII prosperity encouraged the city to sprawl. Developers, wary of the crowded cities of Europe, began building lots of low-density living. The government supported this by building entire suburbs of state houses, making the Kiwi dream of a home and lawn to mow at 6:00 am achievable for most families [3]. Expanding outwards was seen as the answer to avoid the overcrowding common overseas [4]. But like printing more money to fight a war, endlessly creating new suburbs eventually spawned more problems.
Cities aren’t just grids of asphalt and brick. Less an algorithm and more a lush ecosystem of individuals, Auckland is somewhere no person singlehandedly controls how things work. Maybe you sneeze on the bus and someone else gets sick, or you raise rent for a single parent. In either case, your small choices ripple outwards. That’s what makes Auckland a complex adaptive system—a living system comprising many different parts (like people, businesses, and governments) that constantly adapt to one another. The overall behaviour of the system emerges from these countless interactions, often in complex and unpredictable ways. Within this system are smaller parts, or subsystems, such as urban sprawl, traffic patterns, and the housing market. Each influences the others like gears in a machine, making Auckland’s growth more complex than it looks on the surface. [5]
Urban sprawl is the unchecked spread of suburbia outwards rather than upwards. It is driven by demand for single-family housing, cheaper land prices near the edges of a city, and car-centric road networks. Poor zoning decisions, such as not upzoning central areas while building farther out, worsen sprawl [7]. Even when Auckland tries to meet housing demand by upzoning central areas such as Maungawhau / Mount Eden [8], new business districts on the city’s outskirts can undo a lot of the good done. These business hubs necessitate new roads, making the surrounding land more attractive for low-density housing, which adds to sprawl in a vicious cycle.
This is undoubtedly a negative since, against all reason, adding new roads creates more traffic in what is known as induced demand [9]: more roads provide more reason to drive, meaning more people driving at one time. The drive from the city centre to Sylvia Park, for example, is chock-full of idle cars. Why is the largest mall in New Zealand located so far from the city centre? Desirable locations are scattered so widely across Auckland that getting between two places of interest often takes up to three times longer without a car. Public transport exists, but it can take over an hour to get anywhere, especially to non-central destinations. The lack of good public transport and more driving means more road development, fuelling more urban sprawl and a vicious, not-so-positive feedback loop.
Now to the housing market, which fans the flames of the sprawl. Auckland houses are undoubtedly expensive, and developers meet the demand by building far north near the Hibiscus Coast, far south near Drury, and far west near Westgate [8], [10], [11]. This leads to swathes of suburban growth in areas with no strong economic incentives, beyond proximity to a new business hub. These hubs do create jobs, but they also increase commuting distances and traffic, leading to plans for more highways that cut through “undesirable” areas [12]. In the 1960s and 70s, during the construction of the Central Motorway Junction (which includes Grafton Gully), around 15,000 homes were bulldozed and about 45,000 Aucklanders were displaced from suburbs like Newton and Freemans Bay. Many of those pushed out were Māori, Pasifika, and other working-class communities. They ended up on the city’s fringes, far from jobs, services, and reliable public transport [13]. Today’s growth patterns risk repeating that history, pushing marginalised communities even further away.
These patterns do not appear out of nowhere. They are emergent behaviours from millions of individual decisions stacking up. More landlords mean less affordable housing, which fuels higher demand [14]. Poor public transport funding means fewer people use it, which increases car dependency and traffic. Business centres placed far from the city encourage more low-density housing, pushing prices higher [15]. The result is a cycle that erodes Auckland’s livability, inching it towards a car-centric desert like San Bernardino, where huge areas of land are swallowed up by parking lots.
Right now, Auckland is laying down the highway to asphalt hell and reinforcing the urban sprawl feedback loop. To stop it, there needs to be systemic change and a shift in how people think about the city. Laws and funding should encourage upzoning and create demand in the city centre, placing housing close to supermarkets, entertainment, and transport hubs. Amsterdam shows how pairing dense housing with safe, extensive cycling infrastructure can cut car dependency without sacrificing quality of life [17]. Montreal’s Express Bike Network [18] is a more realistic model for Auckland, offering fast, connected routes that are proven effective at getting people out of their cars. Paris offers another lesson, where they have cut car traffic by nearly half, replacing lanes and parking with bike paths, green space, and pedestrian zones. Air quality has improved, streets are calmer, and spaces that were once car lanes have now been reclaimed for walking, cycling, and social activities [19]. These changes show how a city can reorient itself around people rather than cars. Better urban planning does more than save us from rotting in traffic. It boosts mental well-being, lowers obesity rates, strengthens community connections, and makes urban life richer for everyone.
Auckland doesn’t have to accept an endless cycle that renders our city inhospitable. Change is not just in the hands of the council and government; it’s in our own too. Push for upzoning near transport hubs. Fund frequent, reliable public transport. Build safer cycleways. Add toll gates to cut peak congestion [20]. The models exist—and they work. In a complex adaptive system, enough small actions can change the city. Call your local MP, sign petitions, and advocate. Then everyone can live a healthier and more active life. If urban sprawl is the gift that keeps us driving, maybe it’s time to stop regifting the same old present.
[1] Ingolfson. Auckland CMJ Southern End. 2006. [Photo]. Available: https://commons. wikimedia.org/wiki/File:Auckland_CMJ_ Southern_End.jpg.
[2] M. McClure. “The founding of Auckland: 1840–1869.” Te Ara – the Encyclopedia of New Zealand. Accessed: Aug. 23, 2025. [Online]. Available: https://teara.govt.nz/ en/auckland-region/page-7.
[3] K. McGill. “Suburbs.” Te Ara – the Encyclopedia of New Zealand. Accessed: Aug. 23, 2025. [Online]. Available: https:// teara.govt.nz/en/suburbs.
[4] A. McClure. “Expansion: 1941–1979.” Te Ara – the Encyclopedia of New Zealand. Accessed: Aug. 23, 2025. [Online]. Available: https://teara.govt.nz/en/ auckland-region/page-10.
[5] T. Carmichael and M. Hadžikadić, “The Fundamentals of Complex Adaptive Systems,” in Complex Adaptive Systems, 1st ed. T. Carmichael, A. J. Collins, and M. Hadžikadić, Eds. Cham, Switzerland: Springer, 2019, pp. 1–16.doi: 10.1007/978-3-030-20309-2_1. Available: https://www. researchgate.net/publication/333780588_The_Fundamentals_of_ Complex_Adaptive_Systems.
[6] Vardion, 2023 NZ Census Population Density - Auckland City. 2024. [Map]. Available: https://commons.wikimedia.org/wiki/File:2023_NZ_ Census_Population_Density_-_Auckland_City.png.
[7] J. P. Rafferty. “Urban sprawl.” Encyclopaedia Britannica. Accessed: Aug. 23, 2025. [Online]. Available: https://www.britannica.com/topic/ urban-sprawl.
[8] Auckland Council. “Future Development Strategy: Summary.” Accessed: Aug. 23, 2025. [Online]. Available: https://www. aucklandcouncil.govt.nz/plans-projects-policies-reports-bylaws/ Documents/future-development-strategy-summary.pdf.
[9] P. Bucsky and M. Juhász, “Long-Term Evidence on Induced Traffic,” Transp. Res. A, vol. 157, pp. 244–257, Mar. 2022. [Online]. Available: https://www.sciencedirect.com/science/article/pii/ S096585642200026X.
[10] J. K. Brueckner, “Urban Sprawl: Diagnosis and Remedies,” Int. Reg. Sci. Rev., vol. 23, no. 2, pp. 160–171, Apr. 2000, doi: 10.1177/016001700761012710. [Online]. Available: https://journals. sagepub.com/doi/10.1177/016001700761012710.
[11] Global Property Guide. “New Zealand Residential Real Estate Market Analysis 2025.” Accessed: Aug. 23, 2025. [Online]. Available: https:// www.globalpropertyguide.com/pacific/new-zealand/price-history.
[12] M. H. Rose and R. A. Mohl, Interstate: Highway Politics and Policy Since 1939. Knoxville, TN: University of Tennessee Press, 2012.
[13] W. Friesen, “The Demographic Transformation of Inner City Auckland,” N. Z. Popul. Rev., vol. 35, pp. 55–74, 2009. [Online]. Available: https:// population.org.nz/wp-content/uploads/2017/04/vol-35_final2009. pdf.
[14] A. Almeida. “Build-to-Let Down.” Financial Times. Accessed: Aug. 24, 2025. [Online]. Available: https://www.ft.com/content/936fc009- ad67-4bcd-b2e2-67448019854c.
[15] OECD Urban Studies, “Transport Bridging Divides,” OECD Publishing, Paris, France, 2020. Accessed: Aug. 24, 2025. [Online]. Available: https://www.oecd.org/en/publications/transportbridging-divides_55ae1fd8-en.html.
[16] formulanone, CA210 Through San Bernardino and Highland Aerial. 2014. [Photo]. Available: https://www.flickr.com/photos/30552029@ N00/50637882901/.
[17] KiM Netherlands Institute for Transport Policy Analysis. “Cycling Facts 2023.” Accessed: Aug. 24, 2025. [Online]. Available: https:// english.kimnet.nl/documents/2024/01/10/cycling-facts-2023.
[18] Eco-Counter. “Public Route Data – St-Denis/Des Carrières.” EcoCounter Public Portal. Accessed: Aug. 24, 2025. [Online]. Available: https://data.eco-counter.com/public2/?id=300016032.
[19] E. Adams. “Cars Are Vanishing from Paris.” Reasons to Be Cheerful.Accessed: Aug. 24, 2025. [Online]. Available: https://reasonstobecheerful. world/cars-are-vanishing-from-paris/.
[20] A. Lovett. “Traffic into Manhattan drops 7.5% in first week of new toll. That’s 43,000 fewer cars a day.” AP News. Accessed: Aug. 24, 2025. [Online]. Available: https:// apnews.com/article/mta-congestionpricing-manhattan-nyc-toll-cbd1d520ccb fbeb68d248e9d2ed3bd62.

Tim is currently studying a Bachelor of Science in biomedical science at the University of Auckland. Originally from Christchurch, he moved north for university and is now making the most of big-city life. He loves cooking, listening to music, gaming, and exploring new topics.
Timothy Na - BSc, Biomedical Science

Jonathan is an award-winning communicator who specialises in clearly presenting complex information to a public audience. He loves crafting crisp and clear copy, public speaking, and storytelling, and empowering his colleagues to thrive in their roles.